124
The typical NMR spectrum that you might have to face in the real world is much more complicated, and therefor much less easily interpreted.
Here is a short list of complications that you might run into:
- The individual lines of signals with high
multiplicities (M > 5) typically
have very low intensities. That means that sometimes not all the lines
are above the noise level in a recorded spectrum.
One example is the multiplet of the CH-group in (CH3)2CHCH2OH where M = 21 (see example 3 in 119c and 122). - Multiplets may overlap and thus give the impression of complex line splittings.
- "Long-range"-couplings (i.e.,
spin-spin couplings across more than three bonds) may show stronger
effects than what you have been sown in this tutorial so far (That is
especially the case if p
bonds are involved!).
An example for this effect is the effect of the coupling between the two CH2 groups in CH3COOCH2C=CCH2OH (see 110a). - Real-world spectra are not limited to
first-order spectra. Whenever the diference in frequency
between two coupling groups of protons DABn is of similar magnitude as the
coupling constant JAB of
these two groups, the relative intensities of the individual lines in
the multiplets changes dramatically. Under these circumstances these
patterns cease to follow the simple rules we have described in this
tutorial.
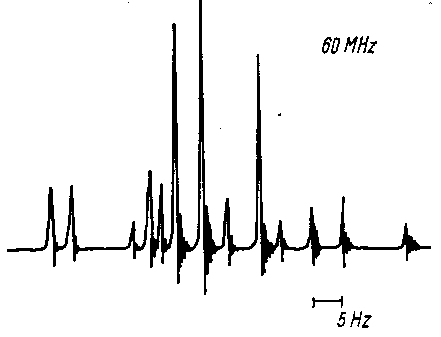
An example for this effect is the signal of the ethylene protons in At a spectrometer frequency
of n0
= 60 MHz they generate a spectrum that wildly deviates from what is
expected in a first order spectrum (Three doublets of doublets with
relative intensities of 1:1:1:1 - check page
96). In a 60 MHz spectrometer, the signals appear at the
following positions:
nA = 344 Hz
nB = 364 Hz
nC = 372 Hz
JAB = 11.75 Hz
JBC = 0.91 Hz
JAC = 17.92 Hz
Compare this to a spectrum recorded at a higher field (Same coupling constants J, but different frequencies n):

If interested feel free to observe the spectral alterations when changing the proton frequency from 60 to 250 MHz or vice versa.
The closely spaced signals of aromatic protons appear for the same reasons frequently as a complicated pattern of individual lines (Check also page 88)."First-order"-spectra can only be expected if :
DAXn > 6 · JAX - Spin-spin couplings between protons and
other magnetically active nuclei (e.g., 31P,
13C or 19F)
can lead to additional line splittings.
An example here is the coupling between 1H and 19F in CH3-CF2-CH2Cl:

Still, even under conditions such as these you can use what you have learned so far about 1H-NMR spectra in the structural determination of molecules:- Based on the absence or presence of signals in specific regions of the spectra you can draw conclusions with respect to the absence or presence of the respective groups in the molecule.
- And the analysis of limited regions of the spectrum with first-order character may deliver answers to at least some structural questions.
Now move on to the last set of problems!